

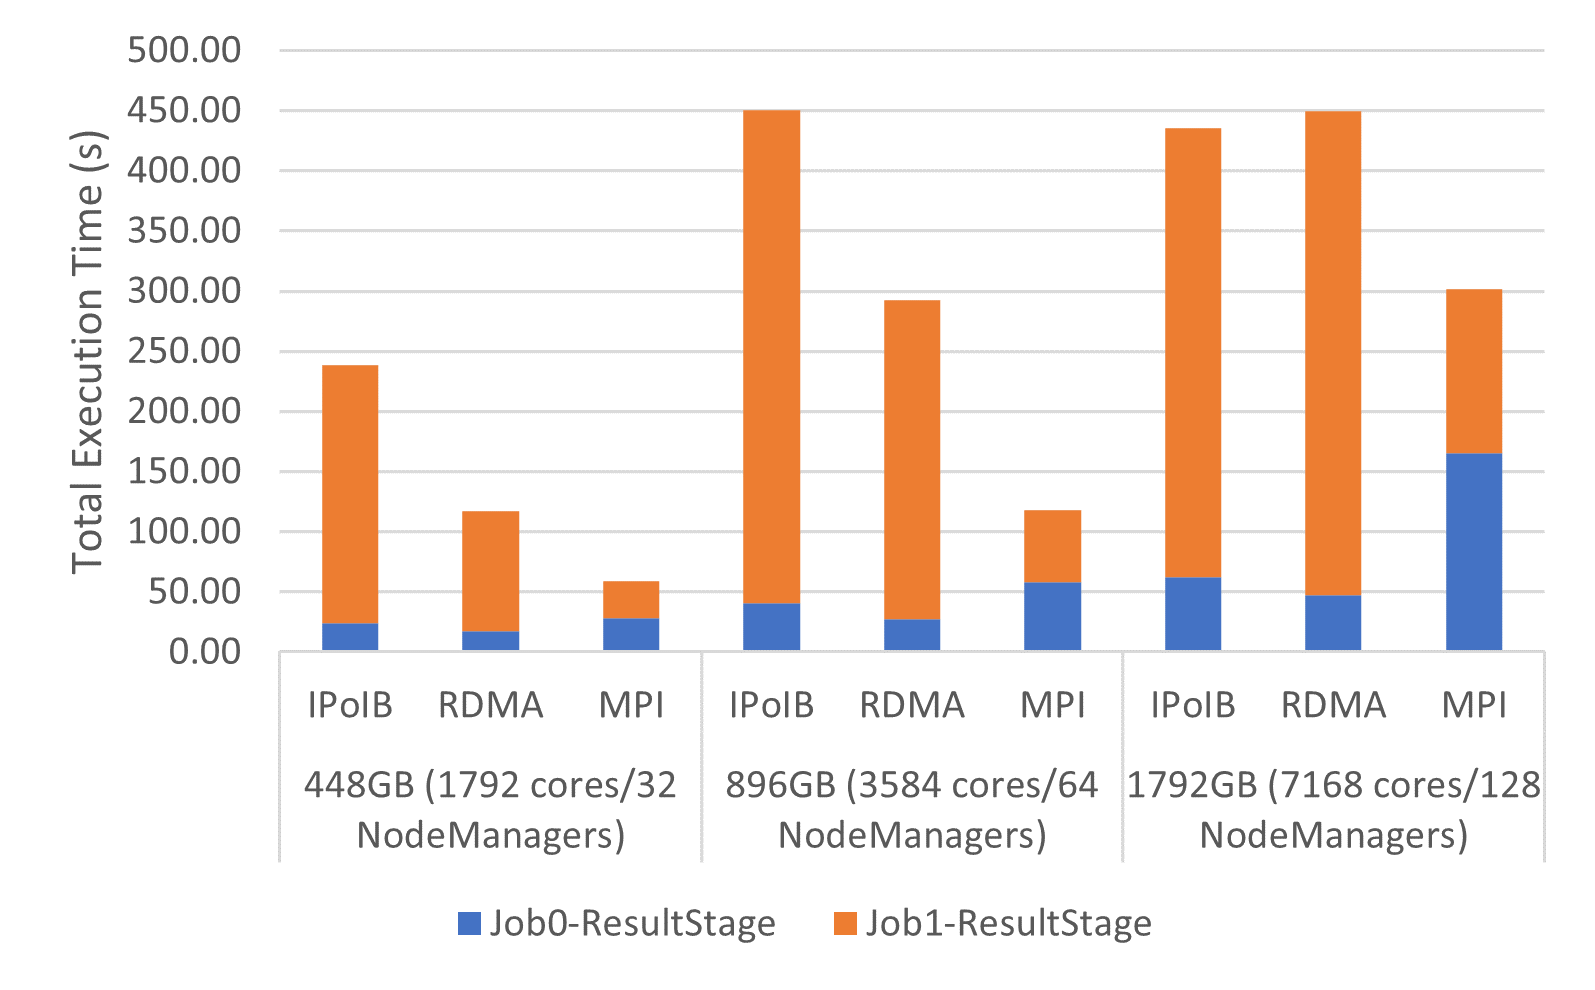
GroupBy Execution Time on Frontera
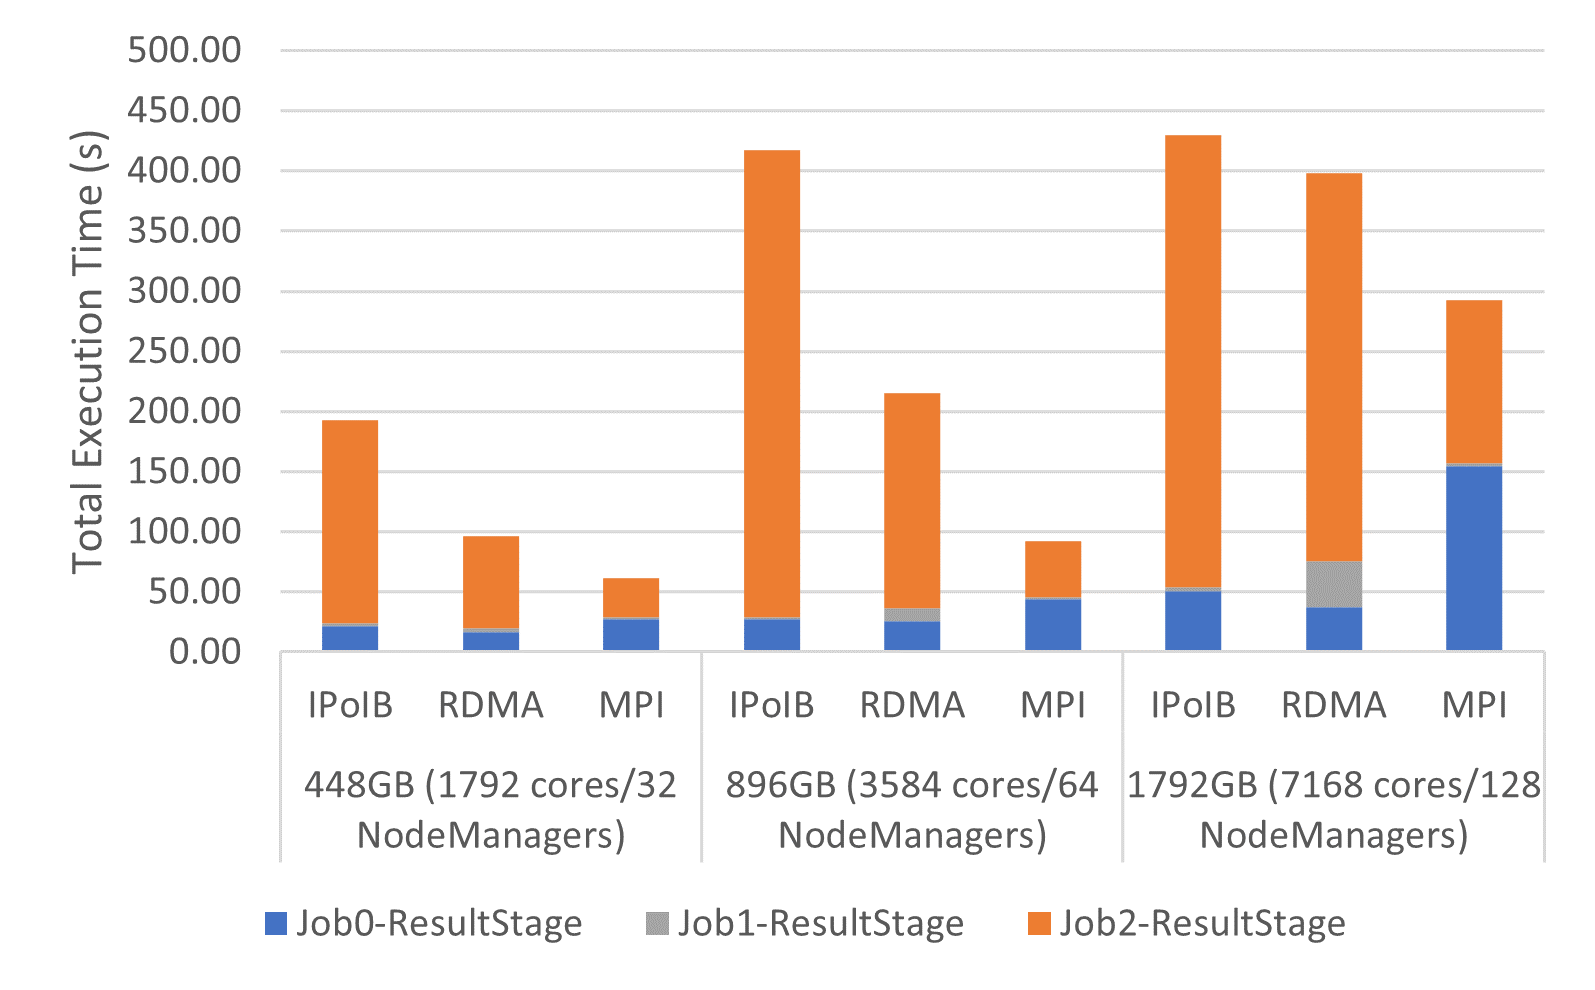
SortBy Execution Time on Frontera
Experimental Testbed: Each compute node in this cluster has two 28-core Intel Xeon Platinum processors, 192GB DDR4 DRAM. The Interconnects used are HDR (100G)
The following are weak-scaling performance numbers of OHB benchmarks (GroupByTest and SortByTest) executed on the TACC Frontera system using the YARN cluster manager. Speed-ups for the overall total execution time for 448GB with GroupByTest is 4.0x and 2.0x compared to IPoIB and RDMA, and for SortByTest for 896GB, the speed-ups are 4.5x and 2.3x, respectively. Speed-ups for the shuffle read stage for 896GB with GroupByTest are 6.8x compared with IPoIB and 4.4x compared to RDMA, while for SortByTest the speed-ups are 8.4x and 3.9x, respectively.
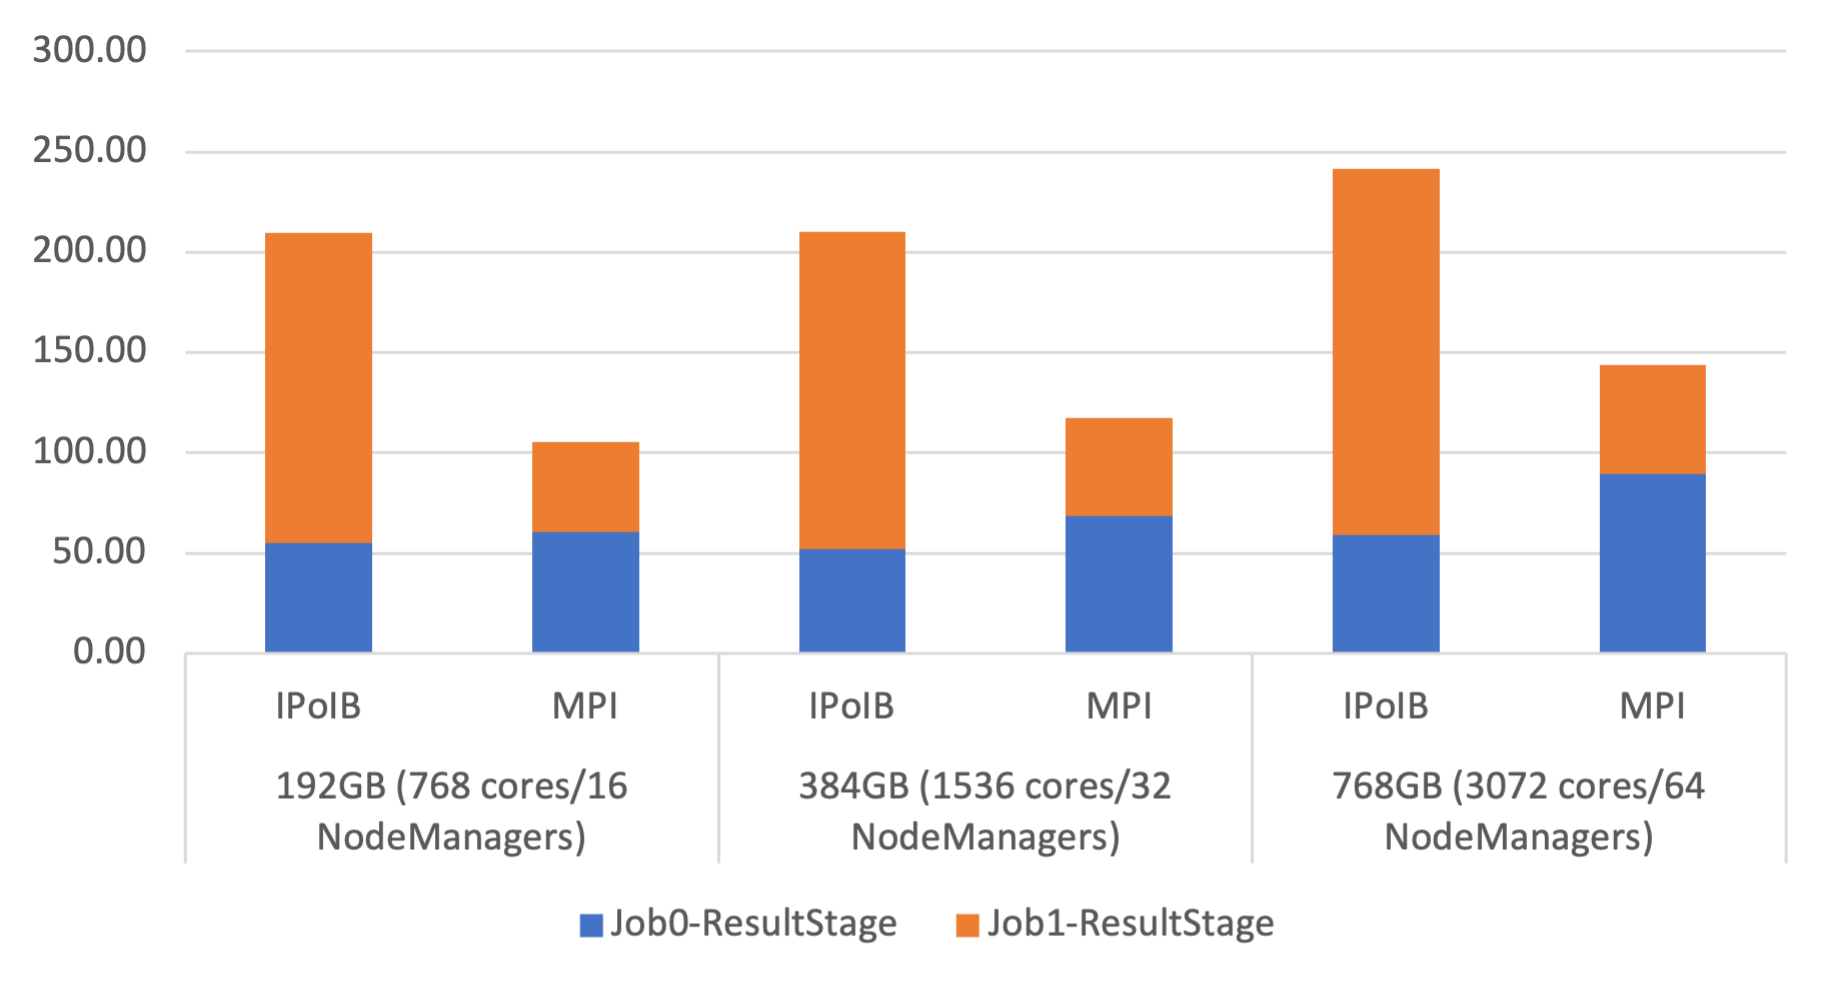
GroupBy Execution Time on Stampede2
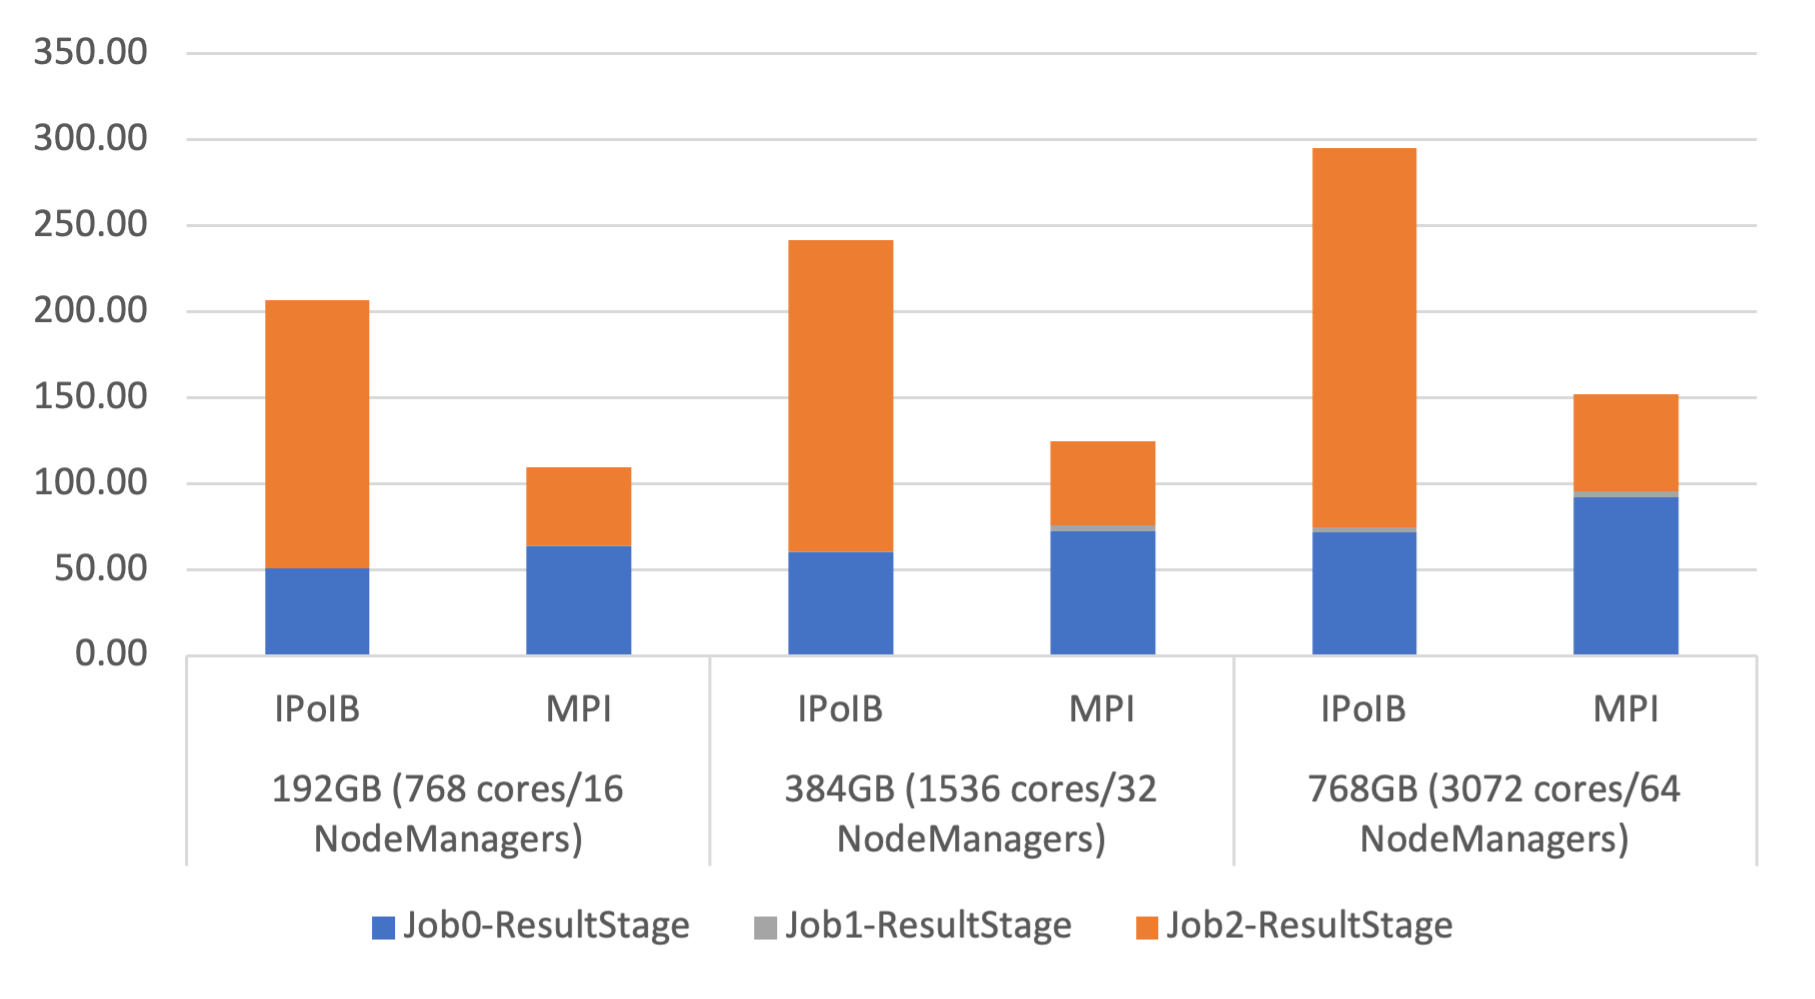
SortBy Execution Time on Stampede2
Experimental Testbed: Each compute node in this cluster is a 48-core Intel Xeon Skylake processors, 192GB DDR-3. The Interconnects used are 100 Gb/sec Intel Omni-Path
The following are the performance numbers of OHB benchmarks GroupByTest and SortByTest executed on the Stampede2 system. Speed-ups for the overall total execution time for 192GB are 2.0x compared to IPoIB for GroupByTest, and for SortByTest, 1.9x. Speed-ups for the shuffle read stage for 768GB are 3.3x compared with IPoIB for GroupByTest, and for SortByTest, 3.9x. RDMA-Spark numbers are not included here since it is not capable of running on non-IB HPC systems.
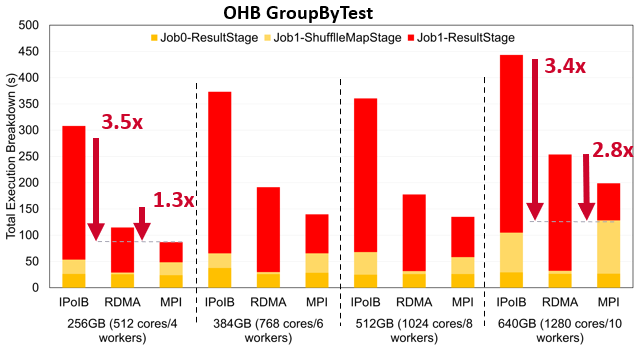
GroupBy Execution Time on MRI
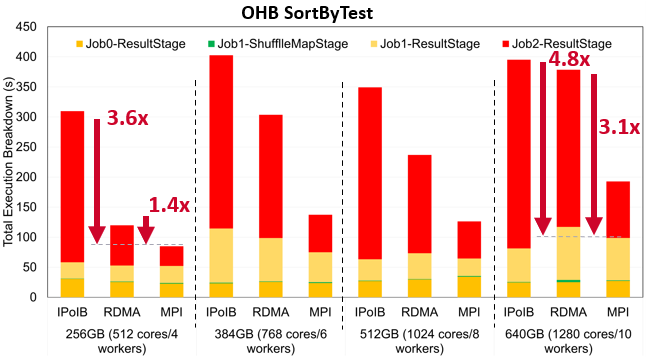
SortBy Execution Time on MRI
Experimental Testbed: Each compute node in this cluster has two 64-core AMD EPYC 7713 processors, 264GB DDR4 DRAM. The Interconnects used are 200Gb/sec (4x HDR)
The following are the performance numbers of OHB benchmarks GroupByTest and SortByTest executed on the MRI system, an in-house system here at the Ohio State University. Speed-ups for the overall total execution time for 256GB are 3.5x and 1.3x compared to IPoIB and RDMA for GroupByTest, and for SortByTest, 3.6x and 1.4x, respectively for IPoIB and RDMA. Speed-ups for the shuffle read stage for 640GB are 3.4x compared with IPoIB and 2.8x compared to RDMA for GroupByTest, and for SortByTest, 4.8x and 3.1x, respectively for IPoIB and RDMA.
GroupBy Execution Time on Frontera
SortBy Execution Time on Frontera
Experimental Testbed: Each compute node in this cluster has two 28-core Intel Xeon Platinum processors, 192GB DDR4 DRAM. The Interconnects used are HDR (100G)
The following are weak-scaling performance numbers of OHB benchmarks (GroupByTest and SortByTest) executed on the TACC Frontera system. Speed-ups for the overall total execution time for 448GB with GroupByTest is 3.8x and 2.1x compared to IPoIB and RDMA, and for SortByTest the speed-ups are 3.4x and 1.7x, respectively. Speed-ups for the shuffle read stage for 112GB with GroupByTest are 13x compared with IPoIB and 5.6x compared to RDMA, while for SortByTest the speed-ups are 12.8x and 3.2x, respectively.
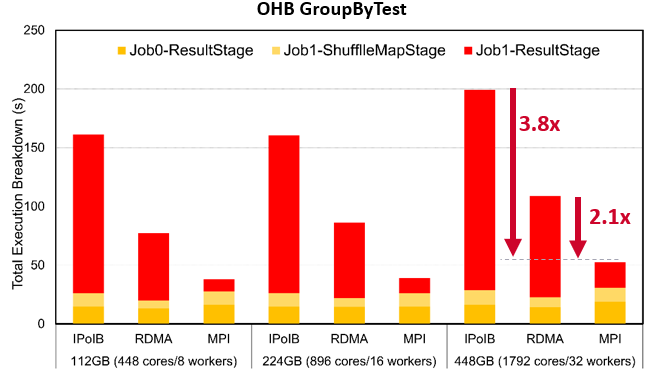
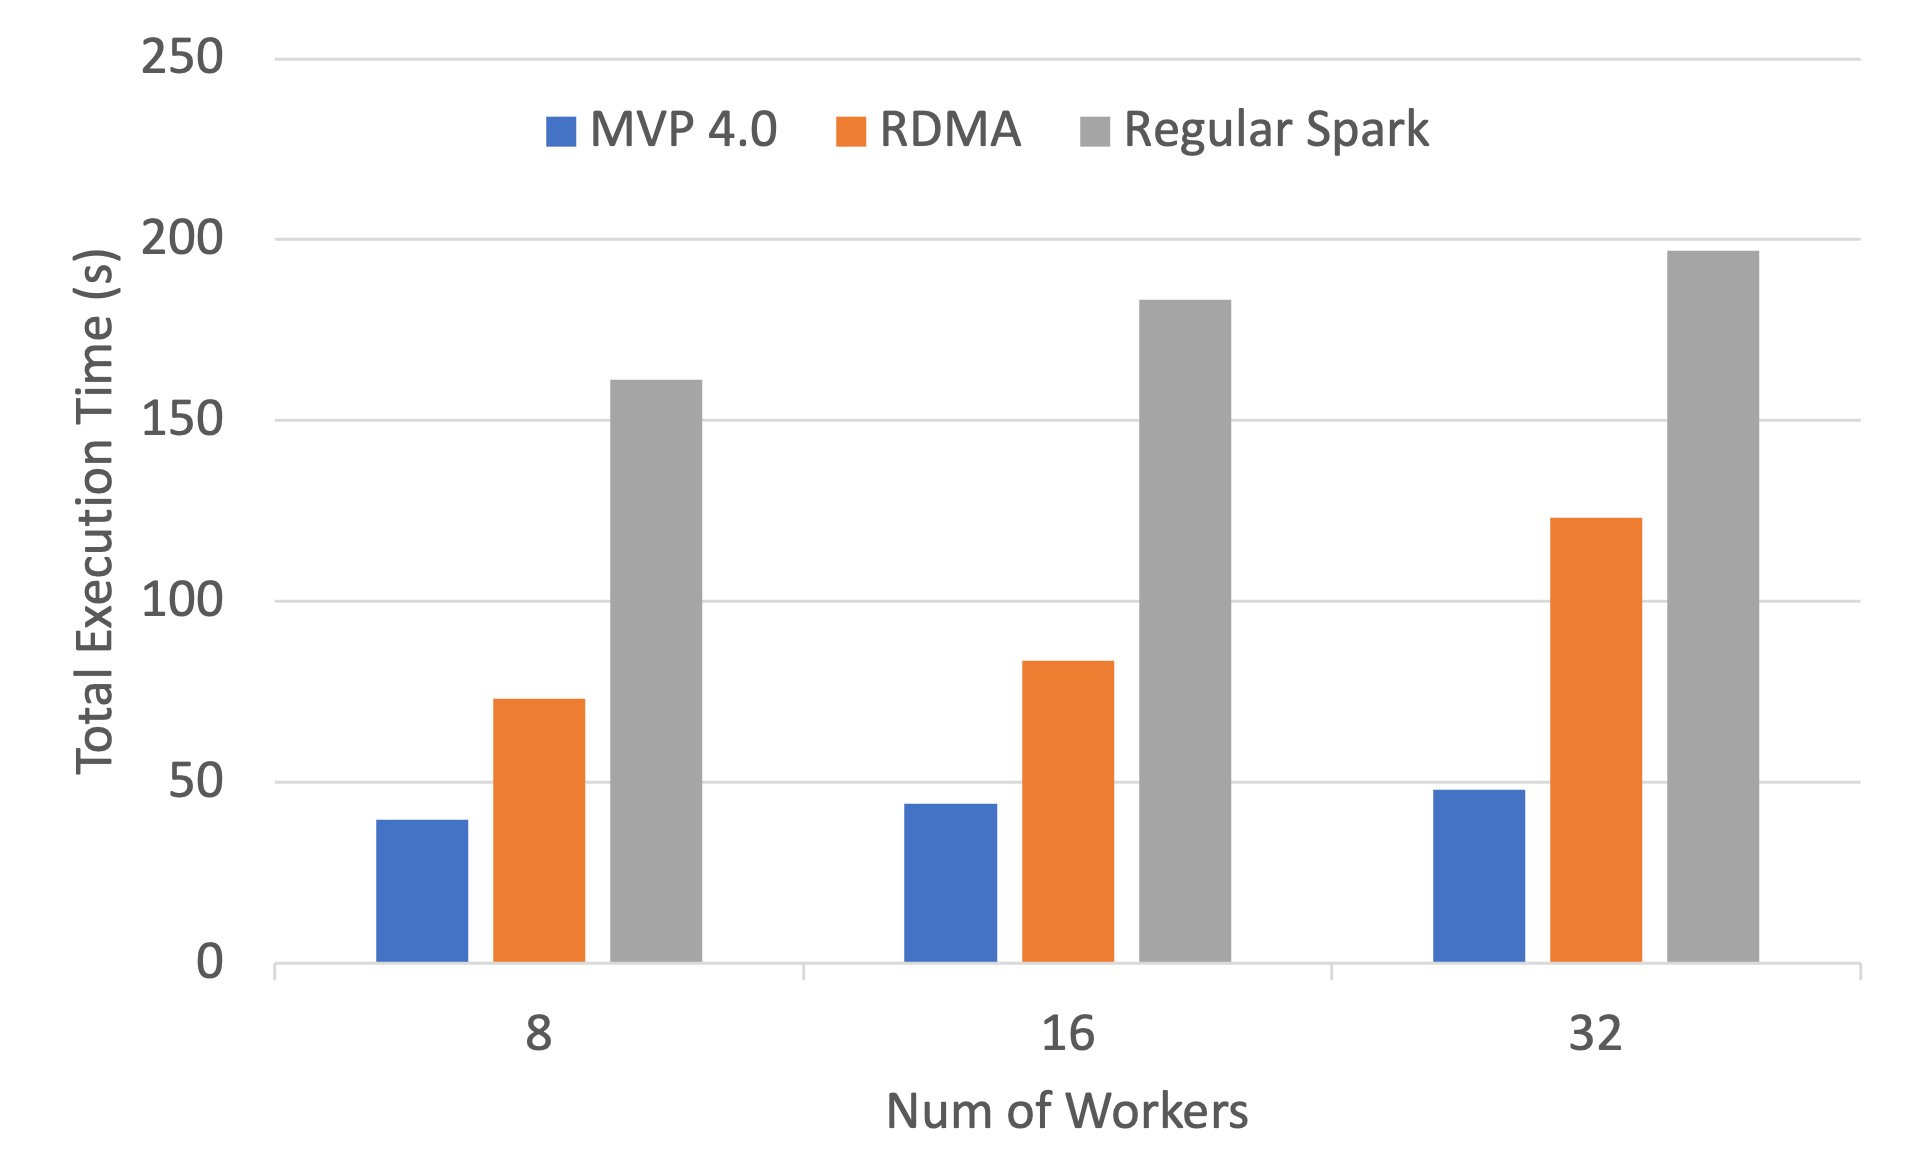
GroupBy Execution Time on Frontera
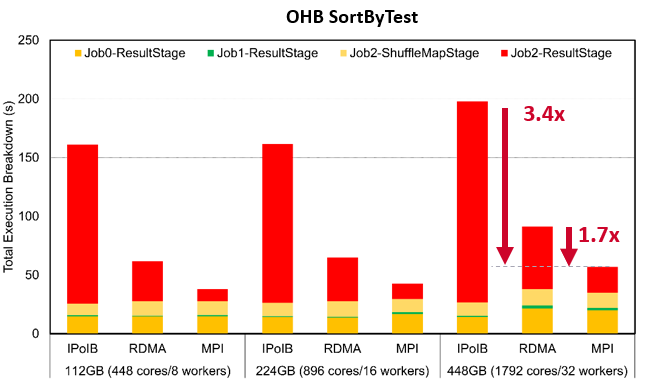
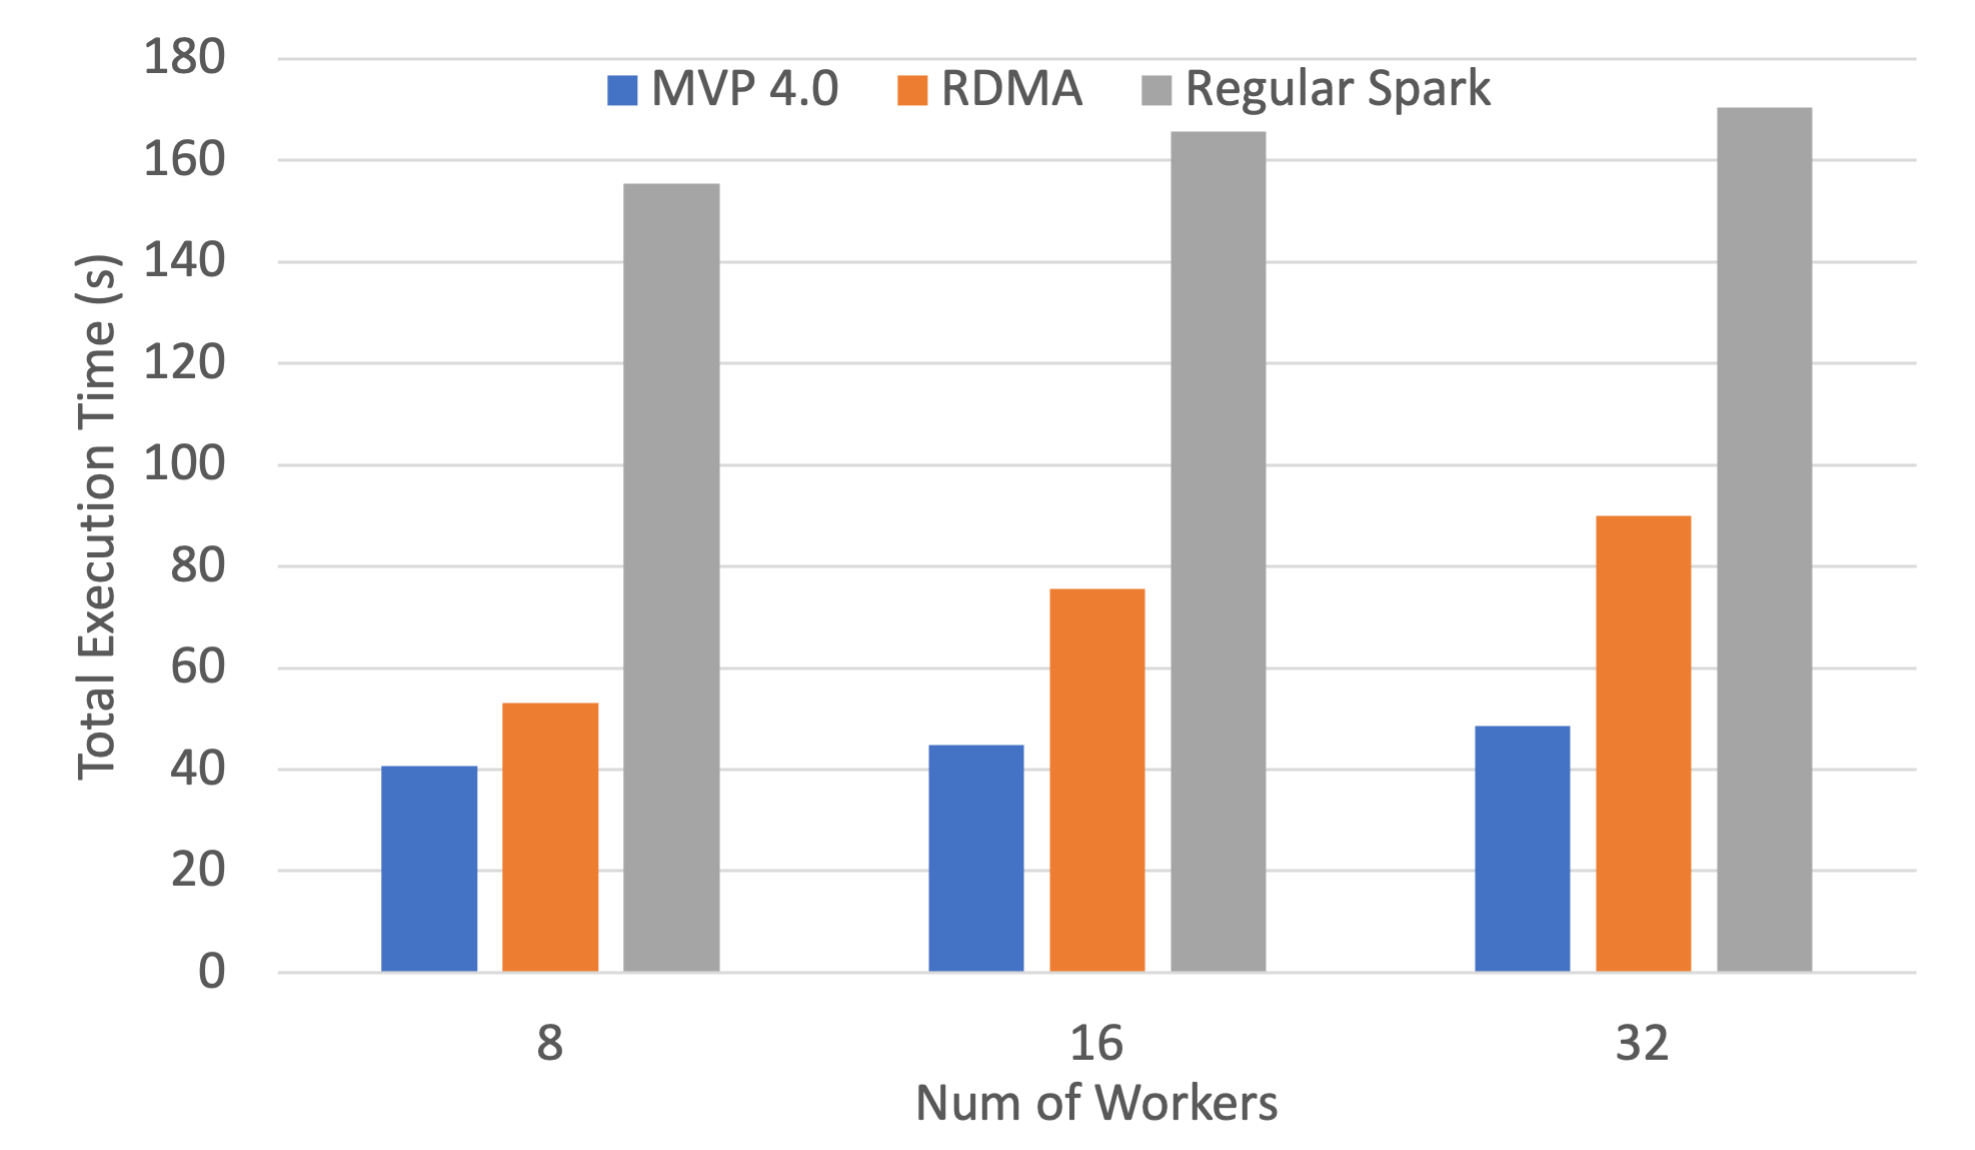
SortBy Execution Time on Frontera
Experimental Testbed: Each compute node in this cluster has two 28-core Intel Xeon Platinum processors, 192GB DDR4 DRAM. The Interconnects used are HDR (100G)
The following are weak-scaling performance numbers of OHB benchmarks (GroupByTest and SortByTest) executed on the TACC Frontera system. Speed-ups for the overall total execution time for 32 workers with GroupByTest is 4.1x and 2.6x compared to IPoIB and RDMA, and for SortByTest the speed-ups are 3.5 and 1.9x, respectively.
Dept of Computer Science and Engineering
2001-2025 NBCL. All rights reserved.


2015 Neil Avenue
Columbus, OH 43210